Battles
Get Ur Rest
Look for Joy
We have
A Big Fight
Ahead
have time to
to send some
money DU`s
way. Support
the summer
fund drive!
I have
DU friends
everywhere.
Rebellions
are built
on HOPE
DU
keeps
HOPE
alive
Thank you
EarlG
all the stickies
on Grovelbot's
Big Board!
U.S. added just 73,000 jobs in July and numbers for prior months were revised much lower
Last edited Fri Aug 1, 2025, 09:08 AM - Edit history (1)
Source: CNBC
Published Fri, Aug 1 2025 8:30 AM EDT Updated 4 Min Ago
Nonfarm payroll growth was slower than expected in July and the unemployment rate ticked higher, raising potential trouble signs for the U.S. labor market.
Job growth totaled 73,000 for the month, above the June total of 14,000 but below even the meager Dow Jones estimate for a gain of 100,000. June and May totals were revised sharply lower, down by a combined 258,000 from previously announced levels.
At the same time, the unemployment rate rose to 4.2%, in line with the forecast.
The June total came down from the previously stated 147,000, while the May count fell to just 19,000, revised down by 125,000.

Read more: https://www.cnbc.com/2025/08/01/jobs-report-july-2025.html
From the source -
Link to tweet
@BLS_gov
·
Follow
Both payroll employment (+73,000) and unemployment rate (4.2%) change little in July #BLSData #EmpSit https://bls.gov/news.release/archives/empsit_08012025.htm
8:30 AM · Aug 1, 2025
Good morning DU - please stay tuned for DU's dedicated economy analysts to provide us with the deep dives into the data and TGIF.

Article updated.
Previous article -
Nonfarm payroll growth was lower than expected in July and the unemployment rate ticked higher, raising potential trouble signs for the U.S. labor market.
Job growth totaled 73,000 for the month, above the June total of 14,000 but below even the meager Dow Jones estimate for a gain of 100,000. June and May totals were revised sharply lower, down by a combined 258,000 from previously announced levels.
At the same time, the unemployment rate rose to 4.2%, in line with the forecast.
The June total came down from the previously stated 147,000, while the May count fell to just 19,000, revised down by 125,000.
This is breaking news. Please refresh for updates.
Original article/headline -
Published Fri, Aug 1 2025 8:30 AM EDT
Nonfarm payrolls were expected to increase by 100,000 in July, according to the Dow Jones consensus estimate. The unemployment rate was expected to be 4.2%.
This is breaking news. Please refresh for updates.
 = new reply since forum marked as read
Highlight:
NoneDon't highlight anything
5 newestHighlight 5 most recent replies
= new reply since forum marked as read
Highlight:
NoneDon't highlight anything
5 newestHighlight 5 most recent replies

gab13by13
(29,458 posts)
BumRushDaShow
(158,623 posts)
rurallib
(64,070 posts)such drastically over stated numbers?

Bernardo de La Paz
(57,672 posts)
wolfie001
(5,938 posts)I mean, you're basically letting us know that traffic is fine down main street Warsaw in November 1939. 
Bernardo de La Paz
(57,672 posts)wolfie001
(5,938 posts)I post to you to get some free therapy (🙏 , but I think things are tumbling out of all of our hands. I hope the mid-terms help us out a bit. Cheers
Bernardo de La Paz
(57,672 posts)wolfie001
(5,938 posts)
Johnny2X2X
(23,223 posts)This is a mere 106,000 jobs added in 3 months, we need 375,000 just to keep up with population growth.
BumRushDaShow
(158,623 posts)I think everyone had a feeling because aside from all the slaughter of federal employees, there were MANY large and small business announcing big layoffs - some due to the whole AI bullshit and others due to trying to deal with the tariffs (and that was what impacted the small businesses the most because they couldn't absorb that).

mathematic
(1,586 posts)Most relevantly, we're going to have to wait and see how the immigrant population changes this year.

PatrickforB
(15,266 posts)has always been just that - it is a wedge designed to feed red meat to the GOP base so they forget they have crappy, rationed healthcare with financially crippling copays, Wall Street is trying to steal Social Security with this (not)new privatization deal, medicare cuts and all that.
The irony, of course, is most small businesspeople I know vote Republican because they mistakenly think the GOP is the party of business. And they are the ones who need the immigrants.
Bernardo de La Paz
(57,672 posts)Not in the long run, since the planet (and humanity) would benefit from a lighter footprint crushing it.

LisaL
(47,318 posts)that we should just believe those.
BumRushDaShow
(158,623 posts)there are still non-partisan civil servants working in these agencies who haven't yet been fired, or have resigned, or have retired or plan to, who are working the numbers. How their numbers are "presented" and "spun" by any 45-appointed "upper management", is a whole different issue (and this might include any directives to modify how the data is collected and/or crunched).
Bernardo de La Paz
(57,672 posts)onenote
(45,586 posts)Or you believe the new numbers but also believe that the same people who published those numbers cooked the books the month before?
Or maybe, just maybe, the folks who publish these numbers didn't cook the books either time.

chicoescuela
(2,239 posts)
Hugin
(36,799 posts)Also, 

chicoescuela
(2,239 posts)Hugin
(36,799 posts)Mortgages, auto loans, and credit cards in particular.
That’s when the plant food will really hit the hibiscus 🌺 (announcing the new family friendly Hugin(tm))
But, there are those who say that default is what someone wants to happen.

underpants
(192,325 posts)that allowed the poor to pay other bills will have ripple effects everywhere.
To say these ideas were drawn up with no cohesion or consideration of ramifications (let alone that many undercut other measures) is an understatement.
the cuts will be made to Medicaid not Medicare, well at least at this time.
Hugin
(36,799 posts)With the closure of hundreds of rural hospitals and clinics. Along with the gutting of the CDC, NIH, and most research & medical education funding. It is all over.
Bernardo de La Paz
(57,672 posts)Hugin
(36,799 posts)Except where they are being blocked by injunction.
Those injunctions aren’t really doing much as the staff and programs they effect are scrambling for the exits.
NickB79
(20,051 posts)$45 billion by 2026 alone
https://www.lwv.org/blog/what-one-big-beautiful-bill-and-its-impact

niyad
(126,336 posts)The monsters in charge WANT what is happening. They intended it. They boasted that thre would be suffering, had to be suffering, things had to be destroyed so they could rebuild better.

where are the Trump apologists? Probably trying to find their talking points

BoRaGard
(7,041 posts)

Wiz Imp
(6,655 posts)+73,000 jobs for July is a super weak report. But even worse, May & June were both revised downward to close to 0 gain. May was revised down by 125,000, from +144,000 to +19,000, June was revised down by 133,000, from +147,000 to +14,000. That's a combined downward revision of 258,000. Taking that into account, The Job level for July is actually 185,000 lower than the initial level reported in June. Absolutely terrible numbers.

LiberalArkie
(18,789 posts)rurallib
(64,070 posts)That there are a lot of government workers out of a job that have not been counted as unemployed or who have taken the buyout that won't be counted for a long time.
Also nice to see Krasnov is fucking with the numbers so any reports from anyplace in his administration are not to be trusted.
Wiz Imp
(6,655 posts)Those people are still being counted as employed until their payments stop. So we should see at least 150,000 drop in Federal Government alone with October's numbers (I believe the payments end in September).
BumRushDaShow
(158,623 posts)you also have a pile of feds who were "fired" but then the courts temporarily halted that (but only for some agencies and done by some courts). So they are in limbo as well - with some returning "temporarily" and others put on "administrative leave" (for now).
And regarding that - the SCOTUS basically tossed out the idea of having "nationwide injunctions" come out of a single court and the courts are now switching to allowing the use of "class action" suits for the same cases, to basically cover what would be a "nationwide injunction" (which is the intent of "class action" ) to cover a large group across all jurisdictions, who are similarly being impacted.

ShazzieB
(21,420 posts)I mean, other than lying about them, which he always does. Just curious.
rurallib
(64,070 posts)It didn't quite come out the way I meant it to be.
ShazzieB
(21,420 posts)It happens to all of us! 
Bernardo de La Paz
(57,672 posts)Cheezoholic
(3,217 posts)I heard one economist say that stagflation can easily get out of control and become a negative feed
back loop on the economy that can be very difficult to stop until it finds the bottom.
Bernardo de La Paz
(57,672 posts)The most famous supply shocks were the 1973 and 1979 OPEC oil embargoes.
Prairie Gates
(5,953 posts)Thank heavens for small mercies!
mathematic
(1,586 posts)And therefore the unemployment rate might remain low even if there isn't strong job growth. He identified this as potential downside weakness in employment conditions. (Because eventually this catches up to non-immigrant workers).
I hadn't seen any data that confirmed that this was already happening but this report is a pretty strong indication. I now expect the jobs numbers to be extremely volatile and as better population estimates come in, they will be revised heavily.
BumRushDaShow
(158,623 posts)If you have LEGAL workers who fear going to the job because they might be snatched, railroaded with trumped-up charges, and then illegally deported, you will have a drop in those returning to work or seeking work.
I know progree had been monitoring the LPR for some time and it was finally readjusting into something that was making sense after the pandemic, so we might start seeing that get scrambled again.
ETA - progree just posted below with data. I checked the LPR chart from here - https://data.bls.gov/timeseries/LNS11300000
Series Id: LNS11300000
Seasonally Adjusted
Series title: (Seas) Labor Force Participation Rate
Labor force status: Civilian labor force participation rate
Type of data: Percent or rate
Age: 16 years and over

And you already see the change happening in 2025.
mathematic
(1,586 posts)Anything that reduces future immigration or discourages current immigrants from staying will lower the laborforce participation rate.
I do think the immigration as a topic hasn't been able to communicate these kinds of impacts. It's been focused on individual impacts (ie, the injustice of summary deportation, etc) or too broadly, like "immigration is good for the economy".
I've tried to talk about the actual mechanics of immigration crackdowns on the economy. Like, if a workplace loses 10% of their workforce due to immigration crackdowns then they don't hire 10% native born workers (that do not exist--we are, or were, at full employment), they lay off some portion of their non-immigrant workforce to downsize their operations.
Immigrants also account for demand. An economy without immigrants is smaller, not just because it's less productive but because it's simply, well, "smaller". There are fewer people in the economy.
So we end up in this scenario where we're used to examining these economic statistics with certain population dynamics assumptions that no longer are true as of 2025.
progree
(12,240 posts)
Nobody wants to work anymore, the oligarchs say.
Jan-July: 83.5, 83.5, 83.3, 83.6, 83.4, 83.5, 83.4
July'24:83.9,
10yr+ peak: 83.9 Jul'24
The regular LFPR ( http://data.bls.gov/timeseries/LNS11300000 ) is everyone age 16+, with no upper age limit, it includes centenarians. It's too messed up with boomer retirements for one to draw conclusions from.
BumRushDaShow
(158,623 posts)(including UNDER 16s), so... 
Project 2025 Would Exploit Child Labor by Allowing Minors To Work in Dangerous Conditions With Fewer Protections
A bill has already been introduced a couple months ago - Republican Wants to Loosen Child Labor Laws
Teenagers Earning Everyday Necessary Skills (TEENS) Act would change the Fair Labor Standards Act of 1938 to adjust federal requirements for child labor laws. It would allow states to create laws allowing 14- and 15-year-olds to work until 9 p.m. year-round. Currently, federal law prohibits them from working past 7 p.m. during the school year.
The bill would also increase the number of hours they can work during the school week from 18 to 24.
(snip)
They have been going full bore since 2023 with this push.

progree
(12,240 posts)Last edited Sun Aug 3, 2025, 12:10 AM - Edit history (3)
And yes, the monthly increases are net gains. The reported nonfarm payroll jobs increases are jobs created and job openings filled minus jobs lost: https://www.democraticunderground.com/10143221098#post24
AND SEASONALLY ADJUSTED - pretty much all the numbers you see reported in the media or BLS summary are the seasonally adjusted ones -- that certainly is true of the headline numbers -- nonfarm payroll jobs, unemployment rate -- as well as many others like the labor force participation rate. (I'm tired of seeing comments like the payroll jobs number is high this time because we're getting into the holiday hiring season, or low because we're done with the holiday season, or it's slow in August etc. Seasonal adjustments adjust for these seasonal cycles - that's why they are called seasonal adjustments)
BLS news release summary: https://bls.gov/news.release/empsit.nr0.htm
The headline payroll job numbers (+73,000 in July) come from the Establishment Survey
https://data.bls.gov/timeseries/CES0000000001
Monthly changes (in thousands): https://data.bls.gov/timeseries/CES0000000001?output_view=net_1mth
YEAR: JAN FEB MAR etc.
2022: 225 869 471 305 241 461 696 237 227 400 297 126
2023: 444 306 85 216 227 257 148 157 158 186 141 269
2024: 119 222 246 118 193 87 88 71 240 44 261 323
2025: 111 102 120 158 19 14 73
The last 2 months (June and July) are preliminary, subject to revisions
Last 12 months: 128k/month average
# Employed in thousands (down 260,000 in July) come from the separate Household Survey, http://data.bls.gov/timeseries/LNS12000000
Monthly changes (in thousands): http://data.bls.gov/timeseries/LNS12000000?output_view=net_1mth
If one adjusts the date range from 2021 to 2025, the graph is much more meaningful because it leaves out the huge swings of 2020 that greatly enlarges the Y axis and makes what follows look like tiny almost undiscernible squiggles around the zero axis
YEAR: JAN FEB MAR etc.
2022: 1016 483 608 --315 487 --284 164 477 75 --126 --177 752
2023: 958 178 417 162 --178 183 204 292 --33 --231 675 --762
2024: 66 --177 412 70 --331 --9 64 206 377 --346 --273 478
2025: 2234 --588 201 461 --696 93 --260
Last 12 months: 157k/month average
January and February of each year are affected by changes in population controls.
A very volatile data series from month to month. I used a double minus to make the negative ones stand out a little better
This Household Survey also produces the unemployment rate and labor force participation rate among many other stats
REVISIONS of the prior 2 months of Payroll Jobs: DOWN 258,000, from the BLS news release:
https://www.bls.gov/news.release/empsit.nr0.htm
for May was revised down by 125,000, from +144,000 to +19,000, and the change for June was revised
down by 133,000, from +147,000 to +14,000. With these revisions, employment in May and June
combined is 258,000 lower than previously reported. (Monthly revisions result from additional
reports received from businesses and government agencies since the last published estimates and
from the recalculation of seasonal factors.)
So compared to the report that came out one month ago we have 73,000 - 258,000 = -185,000 net new payroll jobs reported.
The July 3 report's total nonfarm payroll employment: 159,724k
. . . https://www.bls.gov/news.release/archives/empsit_07032025.htm -- Table B-1
This (August 1 report's) total nonfarm payroll employment: 159,539k -- a 185k decrease
. . . This month's: https://www.bls.gov/news.release/archives/empsit_08012025.htm or https://www.bls.gov/news.release/empsit.t17.htm or https://data.bls.gov/timeseries/CES0000000001
###############################################################
###############################################################
LINKS to some BLS Data Series Numbers and Graphs
Table A - Summary of Household Survey (produces unemployment rate, labor force participation rate) - https://www.bls.gov/news.release/empsit.a.htm
Table B - Summary of Establishment Survey (produces the headline payroll jobs number and the average earnings) - https://www.bls.gov/news.release/empsit.b.htm
Every one of these data series comes with a table and graph:
# Nonfarm Employment (Establishment Survey, https://data.bls.gov/timeseries/CES0000000001
Monthly changes (in thousands): https://data.bls.gov/timeseries/CES0000000001?output_view=net_1mth
NOT SEASONALLY ADJUSTED: https://data.bls.gov/timeseries/CEU0000000001
# Employed in thousands from the separate Household Survey, http://data.bls.gov/timeseries/LNS12000000
Monthly changes (in thousands): http://data.bls.gov/timeseries/LNS12000000?output_view=net_1mth
NOT SEASONALLY ADJUSTED: https://data.bls.gov/timeseries/LNU02000000
# Nonfarm PRIVATE Employment (Establishment Survey, https://data.bls.gov/timeseries/CES0500000001
Monthly changes: https://data.bls.gov/timeseries/CES0500000001?output_view=net_1mth
^-Good for comparison to the ADP report that typically comes out a few days earlier
NOT SEASONALLY ADJUSTED: https://data.bls.gov/timeseries/CEU0500000001
Earnings of Production and Non-Supervisor Workers (PANSW)
. . . # INFLATION ADJUSTED Hourly Earnings of PANSW http://data.bls.gov/timeseries/CES0500000032
. . . # INFLATION ADJUSTED Weekly Earnings of PANSW http://data.bls.gov/timeseries/CES0500000031
----- Nominal means NOT inflation adjusted. Just plain ordinary greenbacks ----
. . . # Nominal Hourly Earnings of PANSW- http://data.bls.gov/timeseries/CES0500000008
. . . # Nominal Weekly Earnings of PANSW - http://data.bls.gov/timeseries/CES0500000030
# Labor Force http://data.bls.gov/timeseries/LNS11000000?output_view=net_1mth
The labor force is the sum of employed and unemployed. To count as unemployed, one must have actively sought work in the past 4 weeks (just looking at want ads and job postings doesn't count)
# ETPR (Employment-To-Population Ratio) aka Employment Rate http://data.bls.gov/timeseries/LNS12300000
# LFPR (Labor Force Participation rate) http://data.bls.gov/timeseries/LNS11300000
Unemployed, Unemployment Rate
# Unemployed http://data.bls.gov/timeseries/LNS13000000
# Unemployment rate http://data.bls.gov/timeseries/LNS14000000
# Black unemployment rate (%), https://data.bls.gov/timeseries/LNS14000006
# Hispanic or Latino unemployment rate (%), https://data.bls.gov/timeseries/LNS14000009
# White unemployment rate (%), https://data.bls.gov/timeseries/LNS14000003
# U-6 unemployment rate http://data.bls.gov/timeseries/LNS13327709
# Long term unemployed 27 weeks or longer as a percent of total unemployed http://data.bls.gov/timeseries/LNS13025703
------------ end unemployed, unemployment rates --------
# NILF -- Not in Labor Force http://data.bls.gov/timeseries/LNS15000000
# NILF-WJ -- Not in Labor Force, Wants Job http://data.bls.gov/timeseries/LNS15026639
# Part-Time Workers who want Full-Time Jobs (Table A-8's Part-Time For Economic Reasons) http://data.bls.gov/timeseries/LNS12032194
# Part-Time Workers (Table A-9) http://data.bls.gov/timeseries/LNS12600000
# Full-Time Workers (Table A-9) http://data.bls.gov/timeseries/LNS12500000
# Multiple Job holders (Table A-9) - http://data.bls.gov/timeseries/LNS12026619
# Multiple Jobholders as a Percent of Employed (Table A-9) https://data.bls.gov/timeseries/LNS12026620
# Civilian non-institutional population
Seasonally adjusted (they seem to have gotten rid of this) https://data.bls.gov/timeseries/LNS10000000
NOT seasonally adjusted: https://data.bls.gov/timeseries/LNU00000000
. . In Table A-1 https://www.bls.gov/news.release/empsit.t01.htm they show the same numbers for seasonally adjusted and non-seasonally adjusted
LFPR - Labor Force Participation Rate for some age groups
The LFPR is the Employed + jobless people who have looked for work in the last 4 weeks (and say they want a job and are able to take one if offered. Looking for work involves more than just looking at job listings). All divided by the civilian non-institutional population age 16+ (in the case of the regular LFPR, or divided by the civilian non-institutional population of whatever age, gender, race etc. for the various sub-demographic measures. For example. the LFPR of age 25-54 females is the number of those employed or actively seeking work divided by the civilian non-institutional population of age 25-54 females.)
SA means Seasonally adjusted. NSA means Not Seasonally Adjusted
16+: SA: http://data.bls.gov/timeseries/LNS11300000 NSA: http://data.bls.gov/timeseries/LNU01300000
25-34: SA: http://data.bls.gov/timeseries/LNS11300089 NSA: http://data.bls.gov/timeseries/LNU01300089
25-54 ("Prime Age" ): SA: http://data.bls.gov/timeseries/LNS11300060 NSA: http://data.bls.gov/timeseries/LNU01300060
. . . . . . Prime Age Men: SA: http://data.bls.gov/timeseries/LNS11300061
. . . . . . . . . . . .From Jan 1960 to Jan 2025, Prime Age Men LFPR went from 97.1% to 89.4%. That means that the percent not in the labor force went from 2.9% to 10.6%, a 3.7 fold increase in this proportion.
. . . . . . Prime Age Women: SA: http://data.bls.gov/timeseries/LNS11300062
55-64: -------------------- NSA: https://data.bls.gov/timeseries/LNU01300095
55+: SA: http://data.bls.gov/timeseries/LNS11324230 NSA: http://data.bls.gov/timeseries/LNU01324230
65+: SA: ---------------- NSA: http://data.bls.gov/timeseries/LNU01300097
LFPR - Labor Force Particpation Rate (prime age 25-54) by gender
All: http://data.bls.gov/timeseries/LNS11300060
Men: http://data.bls.gov/timeseries/LNS11300061
Women: http://data.bls.gov/timeseries/LNS11300062
More LFPR links including by race: https://www.democraticunderground.com/111695870
ETPR - Employment to Population Ratio for some age groups
SA means Seasonally adjusted. NSA means Not Seasonally Adjusted
16+: SA: http://data.bls.gov/timeseries/LNS12300000 NSA: http://data.bls.gov/timeseries/LNU02300000
25-34: http://data.bls.gov/timeseries/LNS12300089 NSA: http://data.bls.gov/timeseries/LNU02300089
25-54 ("Prime Age" ): SA: http://data.bls.gov/timeseries/LNS12300060 NSA: http://data.bls.gov/timeseries/LNU02300060
55-64: SA: ---------------- NSA: https://data.bls.gov/timeseries/LNU02300095
55+: SA: http://data.bls.gov/timeseries/LNS12324230 NSA: http://data.bls.gov/timeseries/LNU02324230
65+: SA: ---------------- NSA: http://data.bls.gov/timeseries/LNU02300097
Data series finder (employment/unemployment related): https://www.bls.gov/data/#employment
The entire report: http://www.bls.gov/news.release/pdf/empsit.pdf
Inflation rate (CPI)
. . . Monthly report: https://www.bls.gov/news.release/cpi.nr0.htm
. . . Regular CPI: https://data.bls.gov/timeseries/CUSR0000SA0?output_view=pct_1mth
. . . Core CPI: http://data.bls.gov/timeseries/CUSR0000SA0L1E?output_view=pct_1mth
. . . Energy: https://data.bls.gov/timeseries/CUSR0000SA0E?output_view=pct_1mth
. . . Food: https://data.bls.gov/timeseries/CUSR0000SAF1?output_view=pct_1mth
. . . Food at home (groceries): https://data.bls.gov/timeseries/CUSR0000SAF11?output_view=pct_1mth
. . . Calculator at: https://www.bls.gov/data/inflation_calculator.htm
. . . One Screen Data Search for CPI components: https://data.bls.gov/PDQWeb/cu
Grocery prices (food at home) inflation compared to overall inflation rate
. . . . . https://www.in2013dollars.com/Food-at-home/price-inflation
. . . From 1947 to 2021 and from 2000 to 2021, food at home inflation very slightly lagged the overall inflation rate
. . . . . https://www.democraticunderground.com/10142735789
Archives of previous reports - The monthly payroll employment reports from the BLS are archived at Archived News Releases (https://www.bls.gov/bls/news-release/ ). In the list up at the top, under Major Economic Indicators, select Employment Situation ( https://www.bls.gov/bls/news-release/empsit.htm ). That opens up links to reports going back to 1994.
Cheezoholic
(3,217 posts)mcar
(45,141 posts)were usually revised up.
mahatmakanejeeves
(66,379 posts)https://www.bls.gov/bls/news-release/empsit.htm#2025
https://www.bls.gov/bls/news-release/empsit.htm#2024
https://www.bls.gov/bls/news-release/empsit.htm#2023
https://www.bls.gov/bls/news-release/empsit.htm#2022
https://www.bls.gov/bls/news-release/empsit.htm#2021
mathematic
(1,586 posts)If you look at the tables, the annual mean revisions under Biden are all negative back to 22, with the exception of the 1st revisions in '22.
I did the count, and of those 3 years the revisions were 14, 16, and 12 negative out of 24 total revisions (2 revisions per month).
So either you're remembering "first impressions" with 2021 being nearly all positive revisions. Or (more likely) you're getting most of your news of this kind from partisan sources like DU which will highlight positive news and bury negative news.
You can see from the top of that page that the mean revision since 2003 is 9. Just 9! A lot of made of these revisions and their supposed bias but if there really was political bias the mean revision wouldn't be so close to 0.
mahatmakanejeeves
(66,379 posts)Wiz Imp
(6,655 posts)signals a turning point in the economy. It's too soon to say definitively but it certainly appears we may have reached the end of the latest expansion period and may be entering a period of decline.
Note, all the numbers will eventually be revised to match universe counts (mostly taken from data almost ALL employers in the US are required to report every quarter to their state's unemployment insurance departments indicating how many employees they have each month). Those revisions get reflected with each January's data released at the beginning of February (this process is called benchmarking). However, initial (incomplete) total jobs numbers from UI records for first quarter become available in August. Since 2018, BLS has always issued a report on those initial estimates of benchmark revisions with a release in mid- August. For some reason, this year's release isn't scheduled until September 9. Here is what last years 2024 Preliminary Benchmark Revision release looked like.
https://www.bls.gov/ces/notices/2024/2024-preliminary-benchmark-revision.htm
Historical revisions chart
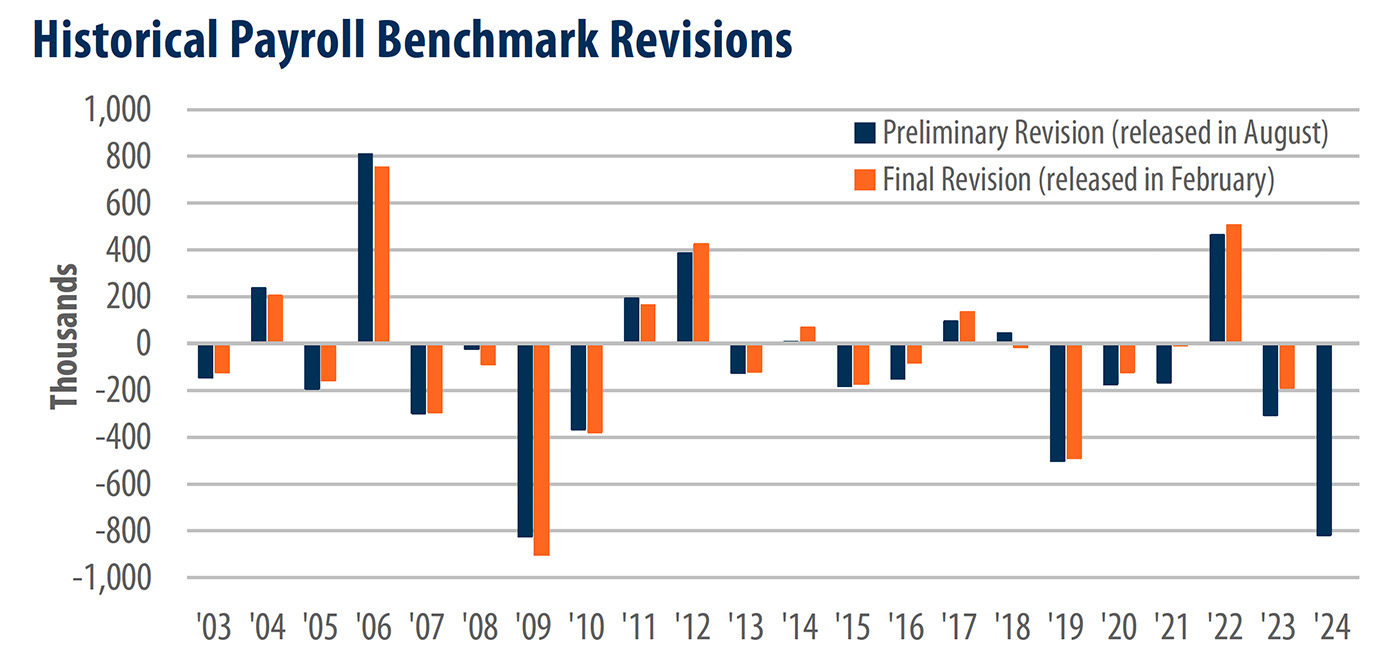
Bernardo de La Paz
(57,672 posts)KPN
(16,867 posts) Wiz Imp
(6,655 posts)Prior to this year, in the past 2 years there were only 2 monthly revisions of over 100,000 and they came in back-to-back months and in opposite directions. With the release of January 2024 data, the change for December was revised up by 117,000. With the release of February 2024 data, the change for January was revised down by 124,000. For this year, starting in March, all monthly revisions have been downward and generally increasing in size each month with the exception of June's release where the prior 2 months were revised up by just 11,000 & 5,000 respectively. If we see big revisions to June & July data next month, it could be a strong sign that we're heading for a recession soon. Note jobs are a lagging indicator
Note, recessions are usually (but not always) defined by 2 consecutive quarters of negative GDP growth. 1st quarter GDP was negative, but the advance release of 2nd quarter was released this week and showed decent growth (+3.0%) but with troubling underlying signs. That number will be revised twice more. If it is revised downward, which seems likely, it will not be good news for the economy. All eyes will be on the nest revision released at the end of 'August.
Hugin
(36,799 posts)What the hell they’re talking about, you just could be in trouble.
underpants
(192,325 posts)
Hugin
(36,799 posts) Doodley
(11,239 posts)Let's see where his supporters will think about that.

Rebl2
(16,838 posts)The July numbers will be revised down too in the next month or two.

FakeNoose
(38,335 posts)1. Americans are paying WAY MORE for everything
2. Americans are making way LOWER paychecks (after adjusting for inflation & COL)
3. More Americans are OUT OF WORK permanently
Way to go Chump - you've hit the trifecta!

ShazzieB
(21,420 posts)progree
(12,240 posts)Dow off 620 points
https://finance.yahoo.com/
VIX (the fear index) up 21%
"stocks buckle under pressure from shock jobs report, Trump tariff blitz"
"US jobs market shows cracks as downward revisions stun in scope"
LetMyPeopleVote
(168,402 posts)The question for the White House is simple: “If Trump has created a ‘hot’ economy, why has American job growth slowed to a 16-year low?”
How weak is the job market? Excluding the pandemic, Americans haven’t seen employment numbers this bad since 2009 — during the Great Recession.
— Steve Benen (@stevebenen.com) 2025-08-01T13:38:22.471Z
The question for the White House is simple: “If Trump has created a ‘hot’ economy, why has American job growth slowed to a 16-year low?â€
https://www.msnbc.com/rachel-maddow-show/maddowblog/us-job-growth-turns-cold-trumps-agenda-takes-toll-economy-rcna222448
Nonfarm payroll growth was slower than expected in July and the unemployment rate ticked higher, raising potential trouble signs for the U.S. labor market. Job growth totaled 73,000 for the month, above the June total of 14,000 but below even the meager Dow Jones estimate for a gain of 100,000.
While the data from July was discouraging, far more important were the drastic revisions from May and June — which were down by a combined 258,000 jobs, compared with earlier, preliminary reporting.
Indeed, according to the revisions, the U.S. economy created just 33,000 jobs combined over May and June, which is a woeful total for an economy that Donald Trump and his Republican cohorts have incessantly described as “hot” in recent weeks.
Over the first seven months of 2025, the latest data suggests the economy has added 597,000 jobs. That might sound like a decent number, but over the first seven months of 2024 — when Trump said the economy was terrible — the total was over 1 million jobs, and over the first seven months of 2023, the U.S. economy added nearly 1.7 million jobs.....
Indeed, the question the president and his team ought to face is simple: “If Trump has created a ‘hot’ economy, why has American job growth slowed to a 16-year low?”
FormerOstrich
(2,835 posts)US adds 147,000 jobs in June, surpassing expectations amid Trump trade war
https://www.theguardian.com/business/2025/jul/03/us-economy-jobs-report
June ADP Report vs. Jobs Report: How Advisors Reconcile Conflicting Jobs Data
https://get.ycharts.com/resources/blog/june-adp-report-vs-jobs-report/
BumRushDaShow
(158,623 posts)where BLS (government) does "all".
progree
(12,240 posts)https://www.msn.com/en-us/money/markets/u-s-private-sector-hiring-tops-forecasts-in-july-says-adp/ar-AA1JAlUj
While today's BLS report has +83,000 increase in private sector jobs
(Govt jobs, federal, state, local, declined by 10,000 jobs)
On the issue of private sector nonfarm payroll vs. all nonfarm payroll:
Private (https://data.bls.gov/timeseries/CES0500000001 ): 135,970k.
All (https://data.bls.gov/timeseries/CES0000000001): 159,539k,
Delta = 23,830k
23,830/159,539 = 14.9%
LetMyPeopleVote
(168,402 posts)This is a horrible jobs report
'Brutal' job report leaves experts reeling: 'Hard to overstate how bad' --- the tRUMP administration & the Republican party = Complete & UTTER FAILURE & they're all evil small little men who bent over for a dumb as a rock bully...
— ladyracer71.bsky.social (@ladyracer71.bsky.social) 2025-08-01T14:58:48.019Z
Link to tweet
https://www.rawstory.com/brutal-job-report-leaves-experts-reeling-hard-to-overestimate-how-bad/
Market analyst Adam Crisafulli, the founder of Vital Knowledge Media, shared Long's view that the Federal Reserve would likely start cutting rates soon and he even believed that the Fed would have cut rates starting this week had it known about the weakness of the labor market.
"Hard to overstate how bad this jobs report was," he commented on X......
Jessica Fulton, a senior fellow at the Joint Center for Political and Economic Studies, argued that the slowdown in hiring, combined with the increased costs consumers are facing thanks to U.S. President Donald Trump's tariffs, are putting American workers in a very tight squeeze.
"The economy continues to show signs of weakening even as the White House pushes policies that will raise costs and make it harder for families to make ends meet," she said. "Labor market cracks that showed up for Black women earlier this year are beginning to expand, with Black male unemployment reaching 7% this month. Black workers are often laid off first when the economy slows down."
Yo_Mama_Been_Loggin
(127,578 posts)Then ask why people are filling all the new farm jobs.
DallasNE
(7,858 posts)And the one 1 month that was over 150,000 was only about 165,000. That is an ugly trend line, to say the least. But these numbers are often volatile, so adjustments could go the other way next month. The 7-month composite should, I would think, move the unemployment percentage more than it has, but with ICE activity, the participation number could be coming down. But with the constant chaos, what can we expect?

speak easy
(12,319 posts)
BlueWavePsych
(3,137 posts)

Turbineguy
(39,244 posts)Trump will fire people until he gets the numbers he wants.
progree
(12,240 posts)progree
(12,240 posts)Yahoo Finance, 8/1/25 1:31 PM CDT
https://finance.yahoo.com/news/president-trump-says-he-will-fire-bls-commissioner-after-july-jobs-report-disappoints-182118416.html
((Blah de blah about the 73,000 net new jobs smaller than expected but the big thing were the huge downward revisions in May and June blah de blah, and, with the revisions, job gains averaged just 35,000/month over the last 3 months -Progree))
Economists on Friday were near-unanimous in their view that July's jobs data and the revisions to May and June reflect a labor market that is far weaker than had been suggested by recent data and characterizations by some officials, notably Federal Reserve Chair Jerome Powell.
In his post on Friday, Trump accused McEntarfer and the BLS of reporting "faked" jobs numbers in the run-up to last year's election, and noted February's benchmark revision to 2024 jobs data that showed payroll growth last year was overstated by some 818,000 jobs.
((quotes from Trump's Truth Social post about how "Important numbers like this must be fair and accurate, they can't be manipulated for political purposes" and ""The Economy is BOOMING under 'TRUMP' despite a Fed that also plays games, " -Progree))
Following Friday's jobs report, data from the CME Group showed traders pricing in an 80% chance the Fed cuts rates at its September meeting; on Thursday, those odds stood at just 37%.
Seems like LBN OP material
So much for some of our arguments about the integrity of the numbers ...
BumRushDaShow
(158,623 posts)Was posted a half an hour before your post! - https://www.democraticunderground.com/10143505506

progree
(12,240 posts)I forgot to check LBN lately and I bet that's what this "My Posts" light-up is about
BumRushDaShow
(158,623 posts)nearly knocked my little iPad off it's clamp with the loud ding!!! 
progree
(12,240 posts)and JOLTS (Job Openings and Labor Turnover Survey), just to list the ones that show up in the right column at the top of the bls.gov page.
===========
In other news
Fed Governor Kugler says resigning from Fed effective Aug 8,
Kugler's term as a governor ends next January. A Fed press release said Kugler will return to Georgetown University as a professor as of this fall.
Kugler's decision advances the timeline for U.S. President Donald Trump to make an appointment to the Fed board by several months.
I don't see much reaction in the stock market following the BLS commissioner firing... the S&P 500 is down 1.62% at 348 PM EDT, but that's about where its been for last 3-4 hours
BumRushDaShow
(158,623 posts)(thanks to another earthquake shaking CNBC breaking news alert on my iPad!
 )
)
I have a little widget on my iPhone that updates the markets and they were down this morning and have been pretty much down all day. At the close (although figures probably a bit delayed) -
Dow = -542.40
NASDAQ = -472.32
S&P = -101.38
progree
(12,240 posts)I'd post here for people viewing this thread.
I do my daily update of the stock market in 20-30 minutes (the basics are quick now that I have the text of the boilerplate part in an Excel spreadsheet, e.g. the title line looks like:
="S&P 500 closed "&TEXT(N7952,"#" & " 7/"&TEXT(M7952,"#" &" at "&TEXT(J7955,"##" &IF(K7957>0,", up ",", down " &TEXT(ABS(K7956),"0.0%" &" for the day, and up "&TEXT(ABS(N7956),"0.0%" &" year-to-date"
which evaluates to:
"S&P 500 closed Thursday 7/31 at 6339, down 0.4% for the day, and up 7.8% year-to-date"
but I usually try also to write a summary of the market day, and that takes some time, unfortunately, and I can't skip doing that today, being end-of-week, and with all the news)
https://www.democraticunderground.com/111699775
ETA DU software sticks in all those smiley faces, replacing, for example every quotation mark followed by a right parenthesis with a smily face. And that's not the only change DU software is making. I could clean this up or take a picture, but you get the idea.
BumRushDaShow
(158,623 posts)I always put a space between the quote mark and parenthesis because DU is using some of those characters to actually generate some quick emoticons (the smilies) using a text combo equivalent.
progree
(12,240 posts)But on seeing it in 5 places, and then seeing all the
#quot
which aren't in the original, and I've have to figure that one out and fix,
I said to heck with that, plus it was getting close to nap time.
Maybe a couple more minutes and I'd have it look like it's supposed to, mostly, but I wasn't being rational at the time.
I read yesterday that a single AI data center planned in Wyoming will INITIALLY use 7.2 times the amount of electricity all houses in the state use. And it is planned to scale up to where it will use 40 times the amount of electricity all houses in the state use.
https://www.democraticunderground.com/1127184317
(They also use a gargantuan amount of water)
After reading that, I thought of all of the time, effort, inconvenience, and discomfort I endure to do my share to save the planet by minimizing household electricity use (I can easily afford the money cost)
and just in general I feel like an idiot to bother to care anymore about much about anything, least of all making an Excel formula look pretty. 
BumRushDaShow
(158,623 posts)I still do what I can to conserve (and recycle, etc).
I may be wrong, but for some reason, this feels like the "dot.com" bubble type of thing that is ramping up and like the "self-check outs" reverting back to employees (and back and forth), along with the infamous "voice menu", that in some cases, got retired for actual humans (but also goes back and forth), they may find that cost of the AI ( "innovation support" ) might outweigh the cost of just plain old humans.
progree
(12,240 posts)the lights briefly flicker and dim, and then AI jumps in with the answer. And just about every one of the list of questions it posts has an AI response.
Somebody said in a thread about this about 3 months ago that putting f**king (fully spelled out of course) in as part of the search query, e.g.
"when was f**king George Washington, the first f**king president of the U.S., born?"
But in my experience AI answers it anyway and just ignores the profanity.
There is something called Web mode (from the More pulldown), that excludes AI, but I can't set it BEFORE the search. But I can set it after the search and repeat the search to get rid of AI results.
Another thing I can try is just leave up that page that's set to Web mode and use that for search.
BumRushDaShow
(158,623 posts)which although has it's own AI option, doesn't thrust it into your face like Google. I know people have recommended other search engines but unfortunately since they don't have the amount of resources (or crawlers) of a Google or Bing, they aren't as helpful as I had hoped!
Very different from the old days, pre-Google, of Yahoo! search. And since Yahoo!'s search is still around, I may try them more (although they also have an AI box but I guess I can scroll down to block viewing it)!
progree
(12,240 posts)from happening in the first place, with its huge electrical and water consumption. Stats vary all over the place on that, but for certain it's several times what an old-fashioned pre-AI search consumed. Somewhere I saw something like a pint of water consumed per AI search (unfortunately that source didn't say anything about electricity). I've read that AI searches vary widely too on their resource consumption..
The Web mode in Google, AFAIK, does only an old-fashioned pre-Zinjanthropus-style search. The problem is turning Web mode on before the search. I haven't figured that out except to leave a tab or page up that is in Web mode already to use for subsequent searches.
But often I like to shut my browser down completely when it gets slow, so bye bye that Web mode tab or page.
If I don't have such a page or tab up, I don't know, maybe search on something like "A" and maybe it won't eat up too many resources.
But I'm probably an idiot to care. I live in a country where most people expect the indoors temperature to be within half a degree of perfect and routinely will jump into their SUVs or monster pickup trucks to buy $15 of groceries,.and are totally befuddled and baffled that anyone sees anything wrong about this.

OhioTim
(357 posts)Trump fires the person who puts out the reports. Surprised it took this long. I don't think we will ever get another legitimate report. Next will be every other report from the federal government having only statistics
that make Trump look good. We won't be able to trust anything.

kyburbonkid
(260 posts)Let's just get to it; Here is the slogan to win; "NEVER REPUBLICAN AGAIN!"
progree
(12,240 posts)Bloomberg, 8/1/25
(no paywall, no quota, no "gimme-your-email-first", none of that, at this MSN-hosted article)
https://www.msn.com/en-us/money/markets/biggest-job-revisions-since-2020-expose-pitfall-of-economic-data/ar-AA1JK1B1
That hints at what’s been a more concerning, underlying trend in not just labor-market data, but statistics overall: declining response rates.
BLS surveys firms in the payrolls survey over the course of three months, gaining a more complete picture as more businesses respond. But a smaller share of firms are responding to the first poll. Initial collection rates have repeatedly slid below 60% in recent months — down from the roughly 70% or more that was the norm before the pandemic.
*GRAPH of response rates to payroll data - 1st, 2nd, and 3rd surveys*
“The more data you’re missing and comes in later, the higher the odds the revisions will be much larger,” said Omair Sharif, president of Inflation Insights LLC. “Fifty percent is just not enough.”
BLS said its analysts have “found no discernible relationship between collection rates and subsequent revisions” to the payrolls data.
Earlier this week, BLS said that about 15% of its sample in the consumer price index — a marquee report on inflation — was suspended from collection on average. That was on top of an announcement in June that the agency suspended collection in three metro areas, which it said happens when its current resources can’t support gathering data.
==============================================
https://www.msn.com/en-us/news/opinion/donald-trump-shoots-the-messenger/ar-AA1JKFw4
He also blames Powell for failing to change policy quickly enough, when, according to Trump himself, the most important data Powell would use to make this decision are unreliable.
mahatmakanejeeves
(66,379 posts)Wed Jun 4, 2025: U.S. Is Trimming Back Its Collection of Consumer Price Data
U.S. Is Trimming Back Its Collection of Consumer Price Data
The cutbacks would have "minimal impact," the government said, but economists warned of reduced confidence in inflation data produced by a struggling statistical system.

The Bureau of Labor Statistics said on Wednesday that it was reducing its collection of price data for goods and services, including grocery items. Graham Dickie/The New York Times
By Ben Casselman
https://www.nytimes.com/by/ben-casselman
June 4, 2025, 7:39 p.m. ET
The Bureau of Labor Statistics is cutting back its collection of data on consumer prices, raising questions about the reliability of federal economic statistics under President Trump. ... Every month, a small army of government workers visits stores and other businesses across the country to check prices of eggs, underwear, haircuts, and tens of thousands of other goods and services. The data collected is the basis for the inflation measures that determine cost-of-living increases in union contracts and Social Security benefits and that guide policymakers at the Federal Reserve when they set interest rates, among other applications.
The Bureau of Labor Statistics, which is part of the Labor Department, said on Wednesday that it was reducing its collection of price data "in areas across the country" and that it had stopped gathering data entirely in Buffalo; Lincoln, Neb.; and Provo, Utah. The agency did not give a specific reason for the cuts, but said it "makes reductions when current resources can no longer support the collection effort." ... The agency said the cuts would have "minimal impact" on estimates of the overall inflation rate, though they could "increase the volatility" of more detailed measures, such as price indexes for individual categories or regions.
But economists said the cuts were the latest blow to a statistical system that was already struggling to maintain the quality of its data in the face of tight budgets and declining response rates to government surveys. ... Those issues predate the Trump administration. In a major report last year, the American Statistical Association warned that the reliability of economic data and other government statistics was in jeopardy.
But those concerns have grown since Mr. Trump returned to office. In March, Howard Lutnick, the commerce secretary, suggested that he planned to change the way the government calculated gross domestic product. The administration also disbanded several advisory committees that provided input on statistical issues. And numerous government data sets were taken offline early in Mr. Trump's term, although most have been restored. ... Current and former employees at the Bureau of Labor Statistics, Census Bureau and other agencies consistently say they have seen no evidence of political interference in government statistics. Economists say they still believe the numbers are reliable.
{snip}
Ben Casselman is the chief economics correspondent for The Times. He has reported on the economy for nearly 20 years.
https://www.nytimes.com/by/ben-casselman
-- -- -- -- -- --
The story ran as an exclusive earlier in The Wall Street Journal., but it's behind a paywall.
__________
https://www.wsj.com/economy/cpi-inflation-data-accuracy-8bd2a8ae
EXCLUSIVE ECONOMY
Economists Raise Questions About Quality of U.S. Inflation Data
Labor Department says staffing shortages reduced its ability to conduct its massive monthly survey
By Matt Grossman
Updated June 4, 2025 at 3:27 pm ET
Some economists are beginning to question the accuracy of recent U.S. inflation data after the federal government said staffing shortages hampered its ability to conduct a massive monthly survey.
The Bureau of Labor Statistics, the office that publishes the inflation rate, told outside economists this week that a hiring freeze at the agency was forcing the survey to cut back on the number of businesses where it checks prices.
{snip due to paywall}
orangecrush
(26,313 posts)progree
(12,240 posts)for example private payrolls from ADP vs. BLS
The first column is the BLS private payrolls number month-over-month increases https://data.bls.gov/timeseries/CES0500000001?output_view=net_1mth
The second column is the ADP private payrolls month-over-month increases https://fred.stlouisfed.org/data/ADPMNUSNERSA (I had to do spreadsheet work to come up with the month to month differences)
The 3rd column is the difference between the BLS and ADP numbers
The first 2 columns are month-over-month increases beginning with February 2023. In thousands.
Positive ones in the 3rd column mean that the BLS number was higher than the ADP number.
BLS ADP DIFF
250 157 93
48 -53 101
167 132 35
166 52 114
170 146 24
110 138 -28
108 119 -11
89 95 -6
117 130 -13
97 100 -3
213 95 118
73 129 -56
151 91 60
169 82 87
129 113 16
160 164 -4
66 136 -70
40 42 -2
33 180 -147
208 194 14
-1 221 -222
244 204 40
287 176 111
79 186 -107
107 84 23
114 147 -33
133 60 73
137 29 108
74 -23 97 - ADP revised from -33 to -23
83 104 -21 - The latest, for July, reported 7/30 by ADP and 8/1 by BLS
===============================================================
I'm also reminded of the wild difference between two BLS employment measures:
https://www.democraticunderground.com/10143505265#post17
The headline payroll job numbers (+73,000 in July) come from the Establishment Survey
https://data.bls.gov/timeseries/CES0000000001
Monthly changes (in thousands): https://data.bls.gov/timeseries/CES0000000001?output_view=net_1mth
YEAR: JAN FEB MAR etc.
2022: 225 869 471 305 241 461 696 237 227 400 297 126
2023: 444 306 85 216 227 257 148 157 158 186 141 269
2024: 119 222 246 118 193 87 88 71 240 44 261 323
2025: 111 102 120 158 19 14 73
The last 2 months (June and July) are preliminary, subject to revisions
Last 12 months: 128k/month average
# Employed in thousands (down 260,000 in July) come from the separate Household Survey, http://data.bls.gov/timeseries/LNS12000000
Monthly changes (in thousands): http://data.bls.gov/timeseries/LNS12000000?output_view=net_1mth
If one adjusts the date range from 2021 to 2025, the graph is much more meaningful because it leaves out the huge swings of 2020 that greatly enlarges the Y axis and makes what follows look like tiny almost undiscernible squiggles around the zero axis
YEAR: JAN FEB MAR etc.
2022 1016 483 608 --315 487 --284 164 477 75 --126 --177 752
2023 958 178 417 162 --178 183 204 292 --33 --231 675 --762
2024 66 --177 412 70 --331 --9 64 206 377 --346 --273 478
2025 2234 --588 201 461 --696 93 --260
Last 12 months: 157k/month average
January and February of each year are affected by changes in population controls.
A very volatile data series from month to month. I used a double minus to make the negative ones stand out a little better
This Household Survey also produces the unemployment rate and labor force participation rate among many other stats
Assuming these are all honest numbers up to now, it just shows how different surveys get different results.
So I hope that a Nobel economics prize winner can tell us, in the future, when surveys vary wildly, which part of that is manipulation, and which part is, well statistical noise and methodology differences.
This posting stimulated by "Caracas on the Potomac (Krugman)"
https://www.democraticunderground.com/100220530941
progree
(12,240 posts)It was 6.2% in January. Latest (July) : 7.2%. That's quite a climb in just 6 months.
https://data.bls.gov/timeseries/LNS14000006
Didn't Trump ask Black people, during his campaign, "What have you got to lose"?
Many more links: https://www.democraticunderground.com/10143505265#post17
(above, in this thread)