Environment & Energy
Related: About this forumUS Western Heatwave Pushing Temperatures Up To 30F Higher Than Normal; "Virtually Impossible" w/o Global Warming
The record-breaking heatwave scorching the US west this week would have been “virtually impossible” if not for the climate crisis, a team of scientists has determined. Millions of Americans from the Pacific coast to the Rockies baked under unseasonably warm and even dangerous temperatures this week, with temperatures up to 30F (17C) above average for the time of year.
The climate crisis, caused primarily by the burning of fossil fuels, has made this kind of heatwave four times more likely to occur over the last decade, according to a new rapid analysis released Friday. “These temperatures are completely off the scale for March,” said analysis co-author Ben Clarke, who is an extreme weather and climate change researcher at Imperial College London, in a statement.
Even as recently as 2016, the current heatwave would have also been milder, with temperatures about 1.4F (0.8C) cooler, says the analysis by World Weather Attribution, an international consortium of climate researchers.
“These findings leave no room for doubt. Climate change is pushing weather into extremes that would have been unthinkable in a preindustrial world,” said Friederike Otto, a climate science professor at Imperial College London, who also worked on the study.
EDIT
https://www.theguardian.com/us-news/2026/mar/20/heatwave-us-west-climate-crisis
 = new reply since forum marked as read
Highlight:
NoneDon't highlight anything
5 newestHighlight 5 most recent replies
= new reply since forum marked as read
Highlight:
NoneDon't highlight anything
5 newestHighlight 5 most recent replies

mwmisses4289
(3,998 posts)I am dreading May, as it seems in my area by may temps start getting to 90+ and stay that way until December.
Add in the humidity and ugh.

Ritabert
(2,372 posts)
OKIsItJustMe
(21,823 posts)An unusually early spring heatwave is developing across the southwestern United States (US), with temperatures that are more typical of summer than mid-March (AccuWeather, 16 March 2026). Driven by a strong, slow-moving high pressure system, called a ‘heat dome’, the event is causing temperatures to rise 11-17℃ (20-30℉) above average across parts of California, Nevada and Arizona (BBC, 17 March 2026). In many areas, temperatures are expected to exceed 37.8℃ (100℉). In Phoenix, temperature forecasts show multiple consecutive days of around 41.1℃ (106℉), a huge increase over the previous all-time March record of 100℉.
The heatwave poses a significant public health threat, particularly given its timing early in the season. The persistent heat dome is creating stable atmospheric conditions, suppressing cloud formation and precipitation, while allowing temperatures to climb, thus expected to cause persistent heat. Extreme heat is the leading cause of weather-related fatalities in the US. Limited overnight cooling and the lack of air-conditioning is expected to add to the heat stress, particularly for vulnerable populations in these parts who are not acclimatised to the heat, including tourists from cooler countries (CNN, 17 March 2026). This heat dome is breaking records for this time of the year, and is in some ways comparable to the persistent system that caused the 2021 Pacific Northwest (PNW) Heatwave. The PNW event occurred later in the year, in June, with temperatures of up to 48.9℃ (120℉) causing hundreds of fatalities (BBC, 17 March 2026).
The impacts of this early-season heatwave are likely to extend beyond health and have environmental implications. High temperatures are expected to accelerate snowmelt in these parts, including the mountains of Colorado where the snowpack levels are already lowest since 1981 due to the preceding warm winter, and the Sierra Nevada region in California, where although snowfall was average, the high heat is likely to drive rapid snowmelt. Early snowmelt in these parts can reduce water availability during the summer months, increasing the risk of water shortages, prolonging and intensifying dry seasons and increasing wildfire danger (Gergel et al., 2017; Uzun et al., 2021)
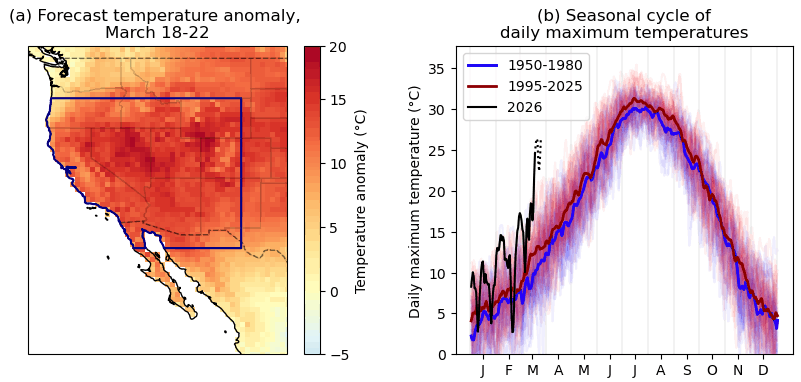
Figure 1: a) Forecasted temperature anomaly over western North America for the period 18th - 22nd March 2026. The study region is shown in dark blue. b) Seasonal cycles of daily maximum temperature within the study region shown in panel (a) for all years since 1950 (shown as thinner lines, coloured blue-red depending on proximity to present day), with 2026 shown in black. The bold red and blue lines show the present (1995-2025) and past (1950-1980) climatology. Data: ERA5.
…