Leading Economic Indicators down 0.1% in May after declining 1.4% in April, Conference Board, 6/20/25 [View all]
Last edited Sat Jun 21, 2025, 02:23 AM - Edit history (1)
https://www.conference-board.org/topics/us-leading-indicators
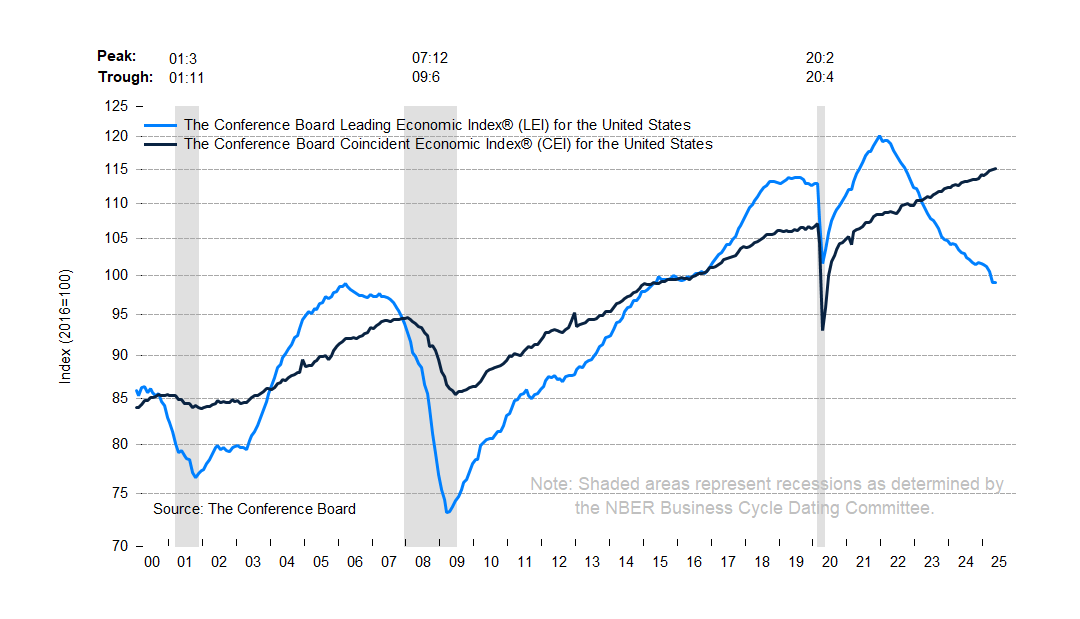
The Conference Board Leading Economic Index® (LEI) for the US ticked down by 0.1% in May 2025 to 99.0 (2016=100), after declining by 1.4% in April (revised downward from –1.0% originally reported). The LEI has fallen by 2.7% in the six-month period ending May 2025, a much faster rate of decline than the 1.4% contraction over the previous six months.
. . . “The recovery of stock prices after the April drop was the main positive contributor to the Index. However, consumers’ pessimism, persistently weak new orders in manufacturing, a second consecutive month of rising initial claims for unemployment insurance, and a decline in housing permits weighed on the Index, leading to May’s overall decline. With the substantial negatively revised drop in April and the further downtick in May, the six-month growth rate of the Index has become more negative, triggering the recession signal. The Conference Board does not anticipate recession, but we do expect a significant slowdown in economic growth in 2025 compared to 2024, with real GDP growing at 1.6% this year and persistent tariff effects potentially leading to further deceleration in 2026.”
The Conference Board Coincident Economic Index® (CEI) for the US inched up by 0.1% in May 2025 to 115.1 (2016=100), after a 0.2% increase in April. The CEI rose by 1.3% over the six-month period between November 2024 and May 2025, more than twice as fast as its 0.5% growth over the previous six months. The CEI’s four component indicators—payroll employment, personal income less transfer payments, manufacturing and trade sales, and industrial production—are included among the data used to determine recessions in the US. Industrial production was the weakest contributor to the index in May and the only CEI component declining.
My emphasis added.
There's a graph of the LEI and the CEI (Coincident Economic Indicators) at the link. The LEI has been dropping in an almost straight line since January 2022, according to this graph.
Edited to add - Here's the graph
 = new reply since forum marked as read