The Most Detailed Infrared Map Of Our Galaxy Has Been Released, Featuring Over 1.5 Billion Objects [View all]
It covers an area of the sky as large as 86,000 full moons.
Dr. Alfredo Carpineti
Senior Staff Writer & Space Correspondent
Edited
by
Laura Simmons
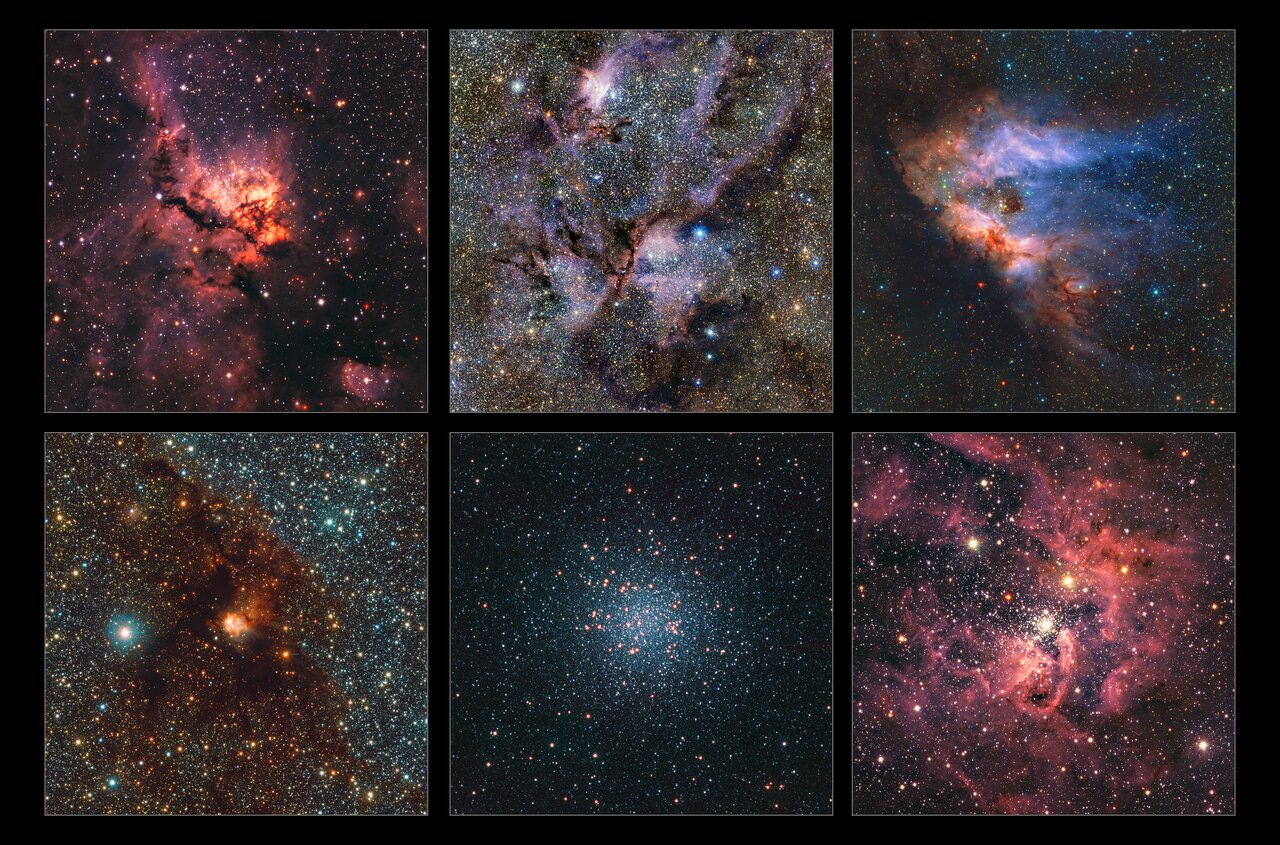
Six of the 1.5 billion objects in the map. Apart from Messier 22 (bottom middle) which is an old group of stars, all the others are star-forming clouds, beautifully seen by VISTA.
Image credit: ESO/VVVX survey
It took more than 13 years and it has more than 500 terabytes of data, but the most detailed infrared map of our galaxy has now been completed. The project was the largest ever conducted by the European Southern Observatory, featuring over 200,000 images snapped by VISTA – the Visible and Infrared Survey Telescope for Astronomy at the Paranal Observatory in Chile.
It’s difficult to do infrared astronomy from the ground, so the telescopes are positioned at high altitudes and where there is very little humidity. The previous map, published in 2012, has one-tenth of the objects. This new follow-up embraces the power of infrared to the max. Using these wavelengths, the team saw through the dust that shrouds the plane of the Milky Way, as well as seeing cold objects, such as brown dwarfs and free-floating planets that have been kicked out of their star systems.
“We made so many discoveries, we have changed the view of our galaxy forever,” Dante Minniti, an astrophysicist at Universidad Andrés Bello in Chile who led the overall project, said in a statement.
This is not an overstatement. Since the project began in 2010, over 300 scientific articles have been published based on the observations. Crucial to those was the data coming from the VISTA Variables in the Vía Láctea (VVV) survey and its companion project, the VVV eXtended (VVVX) survey. Via Lactea is the Latin name for the Milky Way.
Measuring variable stars is crucial to creating the 3D aspect of this map. Certain variable stars have a very precise relationship between the period it takes to brighten and dim and their intrinsic luminosity. From Earth, we can only measure their brightness – how dim they appear being so far away. But if we know the exact luminosity and measure how dim they appear to us, we can work out how far away they must be.
More:
https://www.iflscience.com/the-most-detailed-infrared-map-of-our-galaxy-has-been-released-featuring-over-15-billion-objects-76119
 = new reply since forum marked as read