S&P 500 closed Tuesday 11/25 at 6766, up 0.9%. ADP payrolls, retail sales, wholesale prices, consumer confidence [View all]
Last edited Tue Nov 25, 2025, 08:55 PM - Edit history (211)
The S&P 500 is off 1.8% from its Oct 28 all-time high. It was down more than 5% three trading days ago, which was pullback territory (Pullbacks start at 5% down, Corrections start at 10% down, Bull markets start at 20% down.).
In the future I will only be doing these twice a week: Tuesday and Friday, unless it's really interesting.
10 Year TREASURY YIELD 4.00%, down 0.04 (It local-bottomed out at 3.95% 10/22/25, its lowest point since April.)
https://finance.yahoo.com/quote/%5ETNX/
Bitcoin: (at 8:30 PM ET 11/25) 87,597, down from 89,940. It has wiped out all its gains for 2025 -- it ended 2024 at $93,429. It's in bear market territory, down more than 20% from it's $126,000+ all-time high in October (actually down 30% from that level)
Market news of the day: https://finance.yahoo.com/
Stock market today: Dow, S&P 500, Nasdaq rally for 3rd day as Fed rate cut hopes grow, Apple and Alphabet notch records, Yahoo Finance, 11/25/25
https://finance.yahoo.com/news/live/stock-market-today-nasdaq-sees-biggest-jump-since-may-sp-500-soars-as-alphabet-tesla-lead-tech-rally-210114487.html
I'm not bothering summarizing the above, but I want to point out all the reports that came out today -- 2 government reports, and 2 non-government reports (see title line above)
https://www.democraticunderground.com/1116101288
Scroll down to see earlier in the day reports
========
Coming up, reports
https://www.marketwatch.com/economy-politics/calendar
Non-government reports:
Government reports:
Revised release dates for Bureau of Labor Statistics reports: https://www.bls.gov/bls/2025-lapse-revised-release-dates.htm
Wednesday: initial jobless claims
Thursday: Thanskgiving
Friday: Chicago Business Barometer (PMI)
The October's CPI report has been cancelled and the November CPI won't be released prior to the Fed's December 10 rate-setting meeting. The November report was originally scheduled for 830 AM ET Dec 10, - several hours before the Fed's decision.
On November 21 we learned that they won't see the November jobs report until days after their meeting. And there won't be an October jobs report. The headline non-farm payrolls part for October will be presented with the November data, but again the November report won't come out until days after their meeting. The October unemployment rate will never be presented
=============================================
The S&P 500 closed Tuesday November 25 at 6766, up 0.9% for the day,
and up 17.0% from the 5783 election day closing level,
and up 12.8% from the inauguration eve closing level,
and up 15.0% year-to-date (since the December 31 close)
and down1.8% from its October 28 all-time-high
S&P 500
# Election day close (11/5/24) 5783
# Last close before inauguration day: (1/17/25): 5997
# 2024 year-end close (12/31/24): 5882
# Trump II era low point (going all the way back to election day Nov5): 4983 on April 8
# October 28 all-time-high: 6890.90
# Several market indexes: https://finance.yahoo.com/
# S&P 500: https://finance.yahoo.com/quote/%5EGSPC/
https://finance.yahoo.com/quote/%5EGSPC/history/
Bitcoin
Bitcoin ended 2024 at $93,429. https://finance.yahoo.com/quote/BTC-USD/
Bitcoin's all-time interday high: 126,198 on Oct. 6
Bitcoin's all-time closing high: 124,753 on Oct 6.
https://finance.yahoo.com/quote/BTC-USD/history/
========================================================
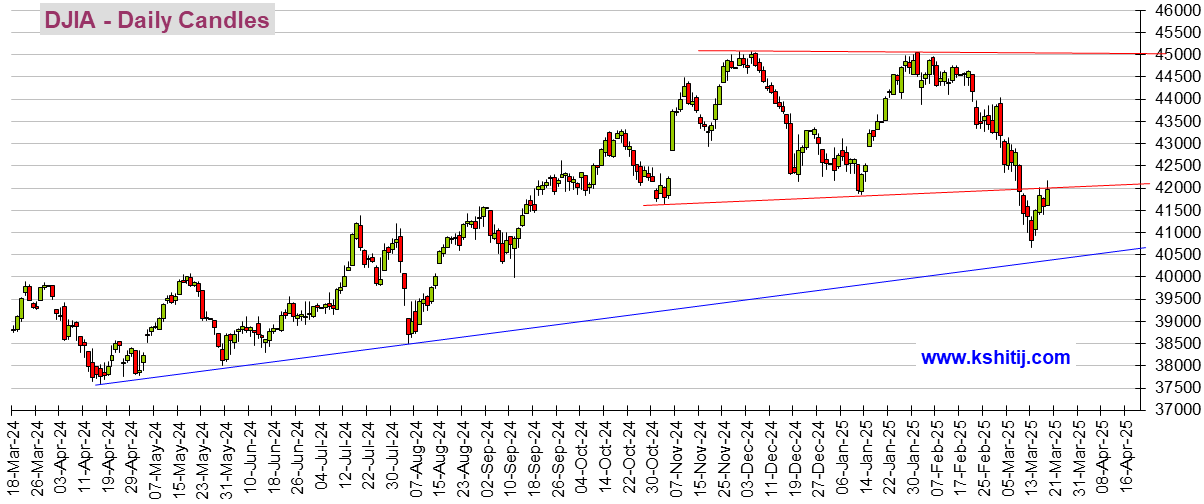
I'm not a fan of the DOW as it is a cherry-picked collection of just 30 stocks that are price-weighted, which is silly. It's as asinine as judging consumer price inflation by picking 30 blue chip consumer items, and weighting them according to their prices. But since there is an automatically updating embedded graphic, here it is. It takes several, like 6 hours, after the close for it to update, like about 10 PM EDT.
(If it still isn't updated, try right-clicking on it and opening in a new tab. #OR# click on https://finance.yahoo.com/quote/%5EDJI/ ).
The Dow closed Monday at 46,448, and it closed Tuesday at 47,112, a rise of 1.4% (664 points) for the day
https://finance.yahoo.com/
DOW: https://finance.yahoo.com/quote/%5EDJI/
. . . . . . https://finance.yahoo.com/quote/%5EDJI/history/
DOW
# Election day close (11/5/24) 42,222
# Last close before inauguration day: (1/17/25): 43,488
# 2024 year-end close (12/31/24): 42,544
DJIA means Dow Jones Industrials Average. It takes about 6 hours after the close to update, so check it after 10 PM EDT. Sometimes it takes a couple days (sigh)
I don't have an embeddable graph for the S&P 500, unfortunately, but to see its graph, click on https://finance.yahoo.com/quote/%5EGSPC/
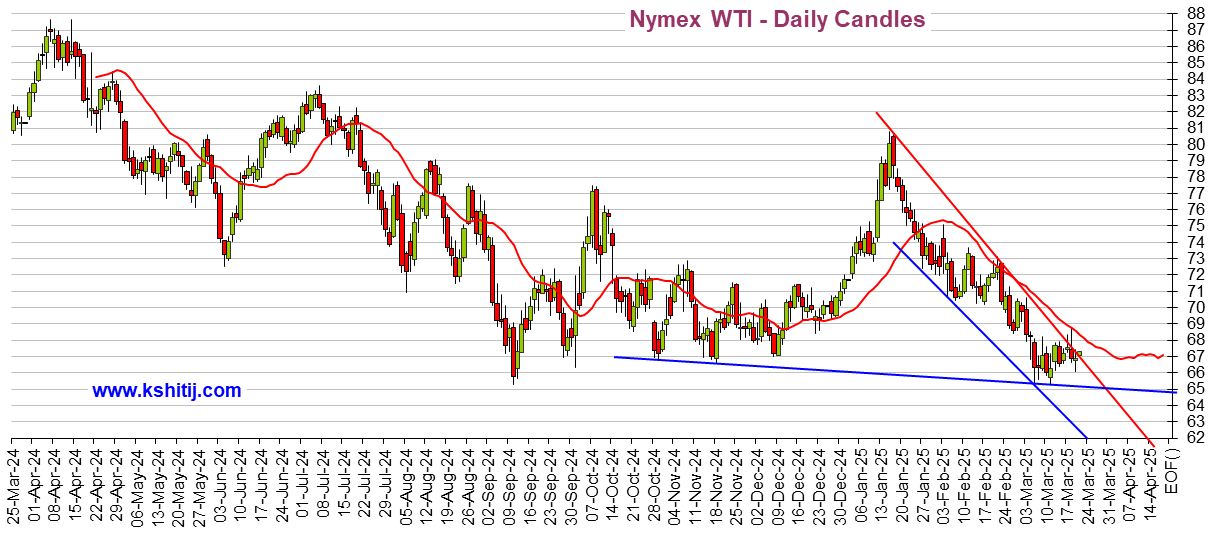
While I'm at it, I might as well show Oil and the Dollar:
Crude Oil
US Dollar Index (DX-Y.NYB)
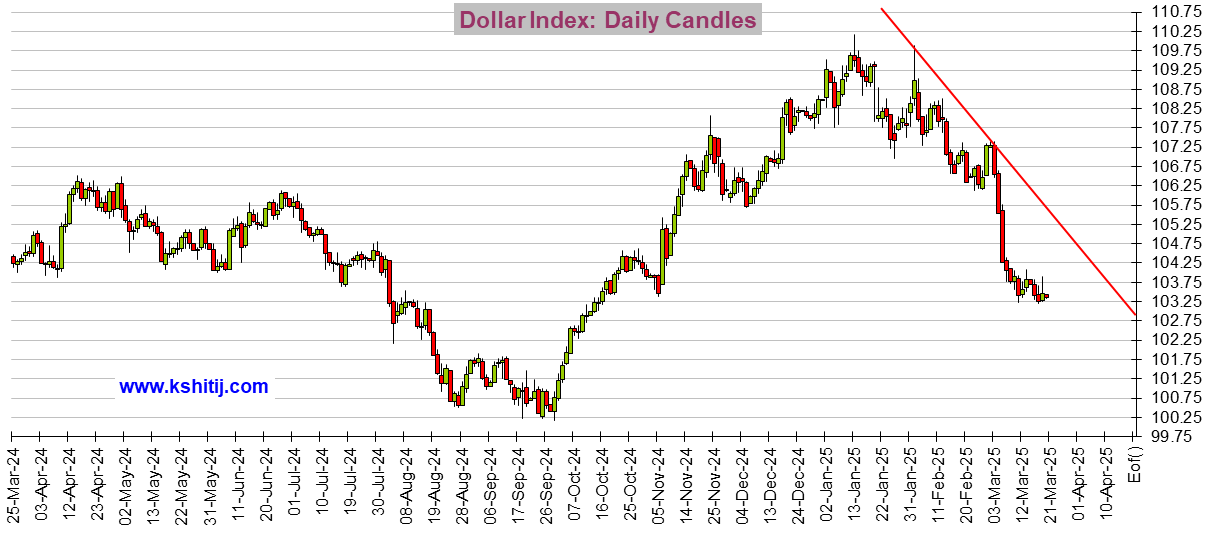
If you see a tiny graphics square above and no graph, right click on the square and choose "load image". There should be a total of 3 graphs. And remember that it typically takes about 6 hours after the close before these graphs update.
🚨 ❤️ 😬! 😱 < - - emoticon library for future uses
 = new reply since forum marked as read
Highlight:
NoneDon't highlight anything
5 newestHighlight 5 most recent replies
= new reply since forum marked as read
Highlight:
NoneDon't highlight anything
5 newestHighlight 5 most recent replies